In psychological assessment, sometimes we want to contrast two scores. For example, suppose we give two tests of visual-spatial ability to an individual. On Test A the score was 95 and on Test B the score was 75.

Two tests of visual-spatial ability differ by 20 points.
Both tests are measured with the index score metric (mean = 100, SD = 15). Because these tests are intended to measure the same ability, we are surprised to see that they differ by 20 points (20 index score points = 1⅓ standard deviations). How common is it for tests that allegedly measure the same thing to differ by 20 points or more?
The answer, of course, depends on the distributions of both variables and the form of the relationship between the two variables. In this case, let’s assume that the tests are multivariate normal, meaning that both variables have normal distributions and any linear combination of the two scores (included subtracting the scores) is also normal.

A Bivariate Normal Distribution with a correlation of 0.6
The relationship between the two variables is linear. Linear relationships are fully described by correlation coefficients. In this case, suppose that the correlation coefficient is 0.6.
Few variables found in nature have a true multivariate normal distribution. However, multivariate normal distributions describe cognitive ability data reasonably well.
The mean of a difference score
The mean of the sum of two variables is the sum of the two means. That is,

It works the same way with subtraction:

The standard deviation of a difference score
The standard deviation of the sum of two variables is the square root of the sum of the two variables’ covariance matrix. The covariance matrix is:
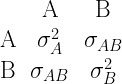
The sum of the covariance matrix is:

The covariance is the product of the two standard deviations and the correlation (ρ):

Thus,

The standard deviation of the difference of two variables is the same except that the covariance is negative.


The prevalence of a difference score
If the two variables are multivariate normal, then the difference score is also normally distributed. The difference of A and B in this example is:

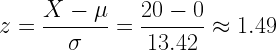
The population mean of the difference scores is 0 and the standard deviation is 13.24.
Using the z-score formula,
The cumulative distribution function of the standard normal distribution (Φ) is the proportion of scores to the left of a particular z-score. In Excel, the Φ function is the NORMSDIST function.

Thus about 7% (1−0.93=0.07) of people have a difference score of 20 or more in this particular direction and about 14% have difference score of 20 or more in either direction. Thus, in this case, a difference of 20 points or more is only somewhat unusual.
The absolute deviation
The standard deviation is a sort of average deviation but it is not the arithmetic mean of the deviations. If you really want to know the average (unsigned) deviation, then you want the absolute deviation. Technically, the absolute deviation is the expected value of the absolute value of the deviation:

Sometimes the absolute deviation is the calculated as the average deviation from the median instead of from the mean. In the case of the normal distribution, this difference does not matter because the mean and median are the same.
In the normal distribution, the absolute deviation is about 80% as large as the standard deviation. Specifically,

The absolute deviation of a difference score
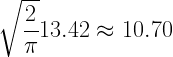
If the two variables are multivariate normal, the difference score is also normal. We calculate the standard deviation of the difference score and multiply it by the square root of 2 over pi. In this case, the standard deviation of the difference score was about 13.42. Thus, the average difference score is:
Why use the absolute deviation?
The standard deviation is the standard way of describing variability. Why would we use this obscure type of deviation then? Well, most people have not heard of either kind of deviation. For people who have never taken a statistics course, it is very easy to talk about the average difference score (i.e., the absolute deviation). For example, “On average, these two scores differ by 11 points.” See how easy that was?
In contrast, imagine saying to statistically untrained people, “The standard deviation is the square root of the average squared difference from the population mean. In this case it is 13 points.” Sure, this explanation can be made simpler…but at the expense of accuracy.
The absolute deviation can be explained easily AND accurately.
The half-normal distribution
Related to the idea of the absolute deviation is the half-normal distribution. The half-normal distribution occurs when we take a normally distributed variable and take the absolute value of all the deviations.

To visualize the half-normal distribution, we divide the normal distribution in half at the mean and then stack the left side of the distribution on top of the right side. For example, suppose that we have a standard normal distribution and we divide the distribution in half like so:

The standard normal distribution divided at the mean
Next we flip the red portion and stack it on top of the blue portion like so:

The half-normal distribution is normal distribution folded in half, with the two halves stacked on top of each other.
What is the mean of the half-normal distribution? Yes, you guessed it—the absolute deviation of the normal distribution!
The cumulative distribution function of the half-normal distribution is:

In Excel the ERF function is the error function. Thus,
=ERF(20/SQRT(2*13.42^2))
=0.86
This means that about 86% of people have a difference score (in either direction) of 20 or less. About 14% have a difference score of 20 or more. Note that this is the same answer we found before using the standard deviation of the difference score.

I am just a parent with no training whatsoever in statistics and measurement. I’m having a little trouble grasping all this (mean and standard deviation I can do, this, well…). My child scored an 80 on a non-verbal IQ test in 2009 (the TONI-3) and then a 43 on the non-verbal portion of the KABC in 2012. That’s a 37 point difference, which seems pretty relevant statistically to this amateur.
I’ve read that there are two reasons IQ scores go down that dramatically: traumatic brain injury and lack of instruction.
Do you have any thoughts on this? I’m trying to understand as much as I can so I can help my child. Thank you, your blog has been a great resource.
I agree, a drop of 37 points is likely to be quite unusual. To obtain a more precise estimate of how unusual the difference is, we would need the correlation between the 2 scores at a 3-year interval. These scores in particular are unlikely to change in response to instruction. However, this does not necessarily mean that brain injury is the explanation. There are many other possible reasons that scores drop. For example, the difference might simply be the result of an inaccurate score (in 2009 or in 2012). I encourage you to discuss the matter with the professional who conducted the assessment.