
The term truncated normal distribution may sound highly technical but it is actually fairly simple and has many practical applications. If the math below is daunting, be assured that it is not necessary to understand the notation and the technical details. I have created a user-friendly spreadsheet that performs all the calculations automatically.
The mean of a truncated normal distribution
Imagine that your school district has a gifted education program. All students in the program have an IQ of 130 or higher. What is the average IQ of this group? Assume that in your school district, IQ is normally distributed with a mean of 100 and a standard deviation of 15.
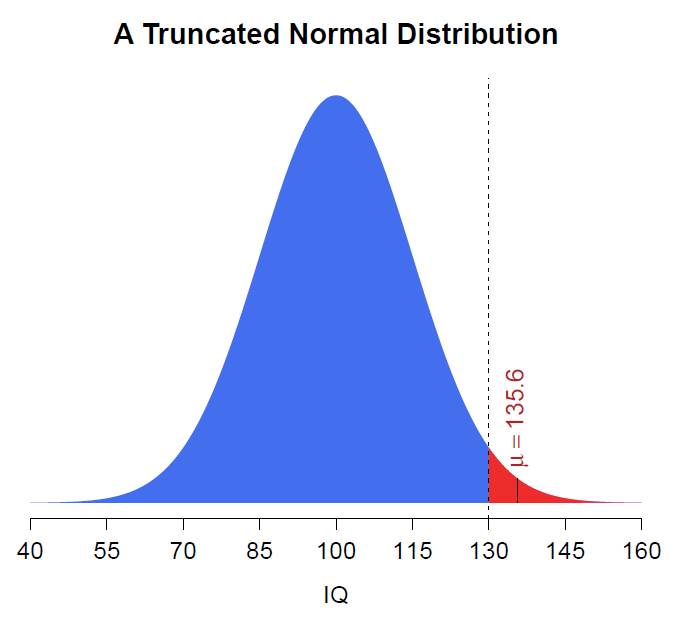
Questions like this one can be answered by calculating the mean of the truncated normal distribution. The truncated normal distribution is a normal distribution in which one or both ends have been sliced off (i.e., truncated). In this case, everything below 130 has been sliced off (and there is no upper bound).
Four parameters determine the properties of the truncated normal distribution:
μ = mean of the normal distribution (before truncation)
σ = standard deviation of the normal distribution (before truncation)
a = the lower bound of the distribution (can be as low as −∞)
b = the upper bound of the distribution (can be as high as +∞)
The formula for the mean of a truncated distribution is a bit of a mess but can be simplified by finding the z-scores associated with the lower and upper bounds of the distribution:


The expected value of the truncated distribution (i.e., the mean):

Where 
NORMDIST(z,0,1,FALSE) in Excel, dnorm(z) in R) and 
NORMSDIST(z) in Excel, pnorm(z) in R).
This spreadsheet calculates the mean (and standard deviation) of a truncated distribution. See the part below the plot that says “Truncated Normal Distribution.”
In R you could make a function to calculate the mean of a truncated distribution like so:
MeanNormalTruncated<-function(mu=0,sigma=1,a=-Inf,b=Inf){
  mu+sigma*(dnorm((a-mu)/sigma)-dnorm((b-mu)/sigma))/(pnorm((b-mu)/sigma)-pnorm((a-mu)/sigma))
}

#Example: Find the mean of a truncated normal distribution with a mu = 100, sigma = 15, and lower bound = 130
MeanNormalTruncated(mu=100,sigma=15,a=130)
The cumulative distribution function of the truncated normal distribution
Suppose that we wish to know the proportion of students in the same gifted education program who score 140 or more. The cumulative truncated normal distribution function tells us the proportion of the distribution that is less than a particular value.

Where

In the previously mentioned spreadsheet, the cumulative distribution function is the proportion of the shaded region that is less than the value you specify.
You can create your own cumulative distribution function for the truncated normal distribution in R like so:
cdfNormalTruncated<-function(x=0,mu=0,sigma=1,a=-Inf,b=Inf){
  (pnorm((x-mu)/sigma)-pnorm((a-mu)/sigma))/(pnorm((b-mu)/sigma)-pnorm((a-mu)/sigma))
}
#Example: Find the proportion of the distribution less than 140
cdfNormalTruncated(x=140,mu=100,sigma=15,a=130)
In this case, the cumulative distribution function returns approximately 0.8316. Subtracting from 1, gives the proportion of scores 140 and higher: 0.1684. This means that about 17% of students in the gifted program can be expected to have IQ scores of 140 or more.1
The truncated normal distribution in R
A fuller range of functions related to the truncated normal distribution can be found in the truncnorm package in R, including the expected value (mean), variance, pdf, cdf, quantile, and random number generation functions.

Pingback: Using the multivariate truncated normal distribution | Assessing Psyche, Engaging Gauss, Seeking Sophia
Pingback: time enough | hbd chick
hello
please i want drive the parameters of truncated normal dist from two sides
In the post, you’ll see that parameters a and b represent the lower and upper bounds of the truncated distribution.
Pingback: Truncated Distribution / Truncated Normal Distribution
Wonderful help, thank you SO much! very useful
How can I use Excel to generate a random numbers follow a truncated normal dist. N~(0.3,0.39) from 0.1 to +infinity ??
Great question:
First, find the area of the normal distribution to the left of 0.1 in ~N(0.3, 0.39) like so:
=NORM.DIST(0.1, 0.3, 0.39,TRUE)
=0.30403844
Now generate random normal numbers with proportions ranging from 0.30403844 to 1 like so:
=NORM.INV(RAND()*(1-0.30403844)+0.30403844,0.3,0.39)
More generally, if
mu = mean of normal distribution before truncation
sigma = standard deviation of normal distribution before truncation
a = lower bound of truncated distribution (use -1e99 for negative infinity)
b = upper bound of truncated distribution (use 1e99 for negative infinity)
then random numbers from truncated distribution can be made like so:
=NORM.INV(RAND()*(NORM.DIST(b, mu, sigma, TRUE) – NORM.DIST(a, mu, sigma, TRUE)) + NORM.DIST(a,mu, sigma, TRUE), mu, sigma)
I hope that helps.
Joel