CHC Theory, Cognitive Assessment, Psychometrics

g Factor Removed from Correlation Matrices, Vizualized

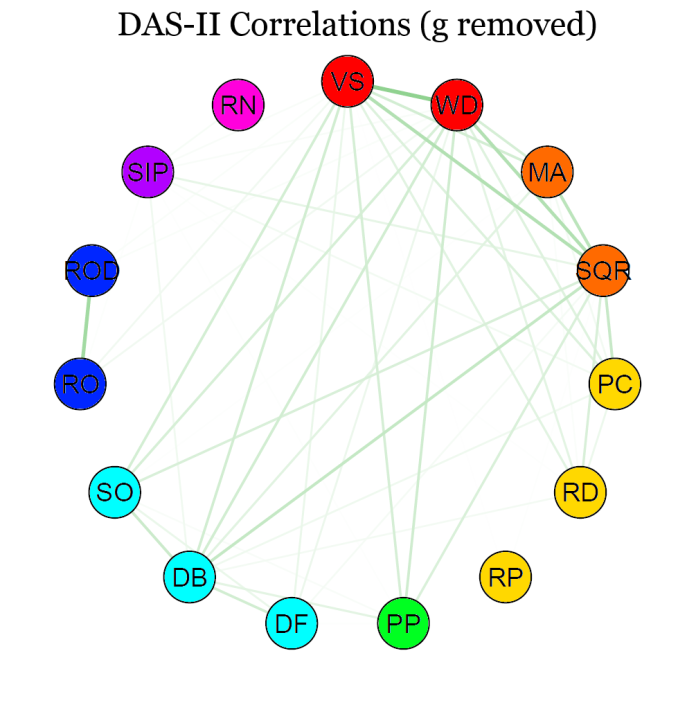
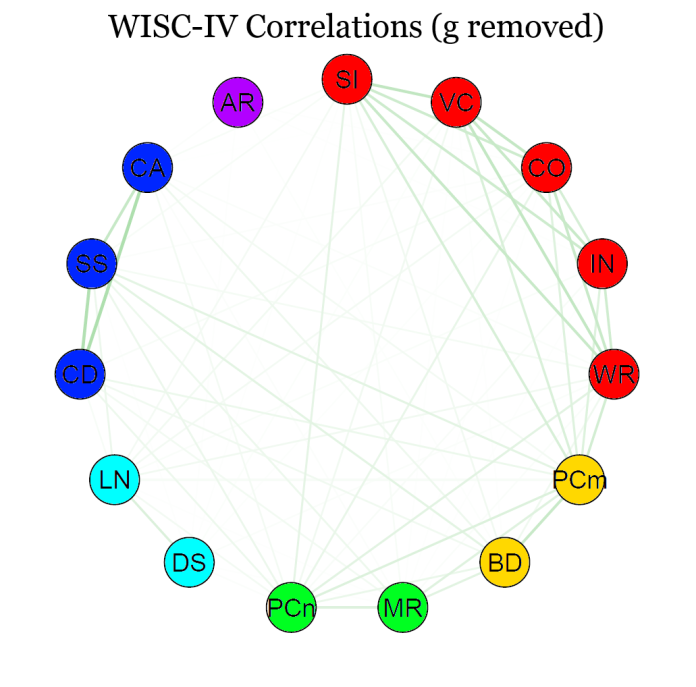
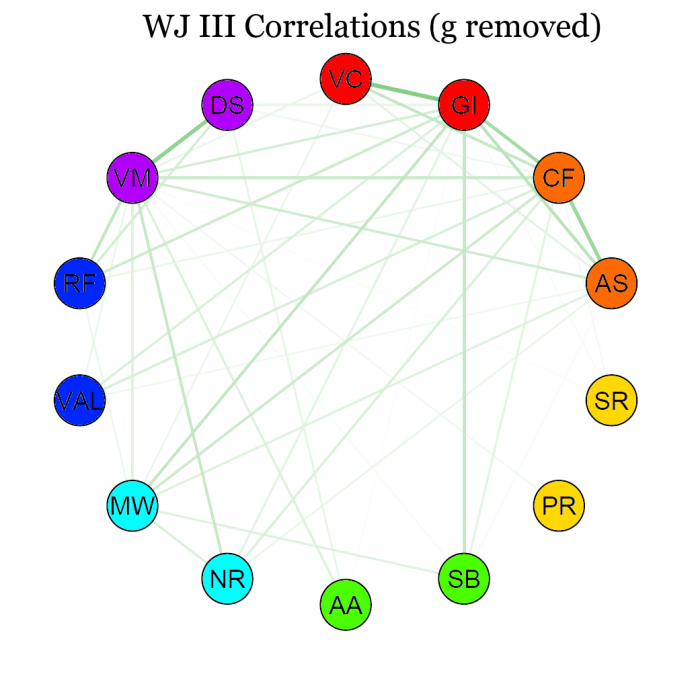
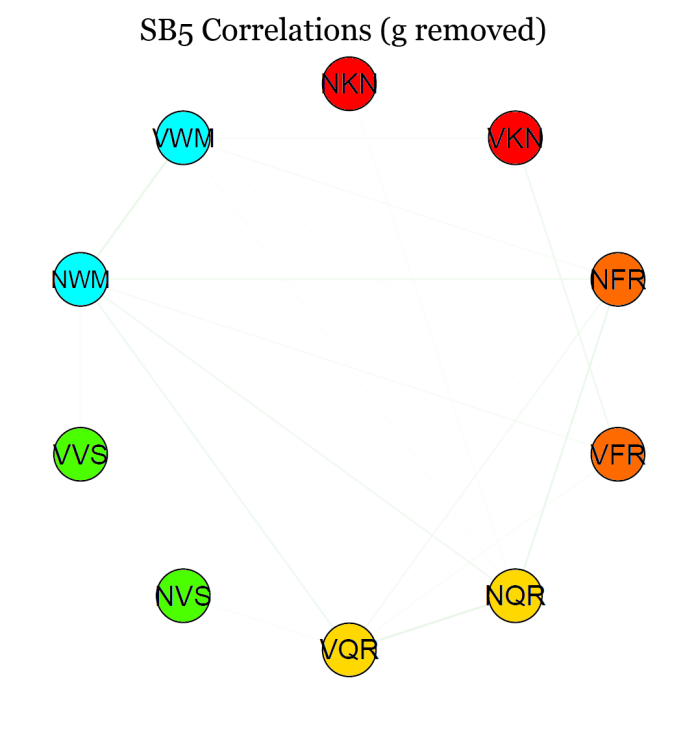
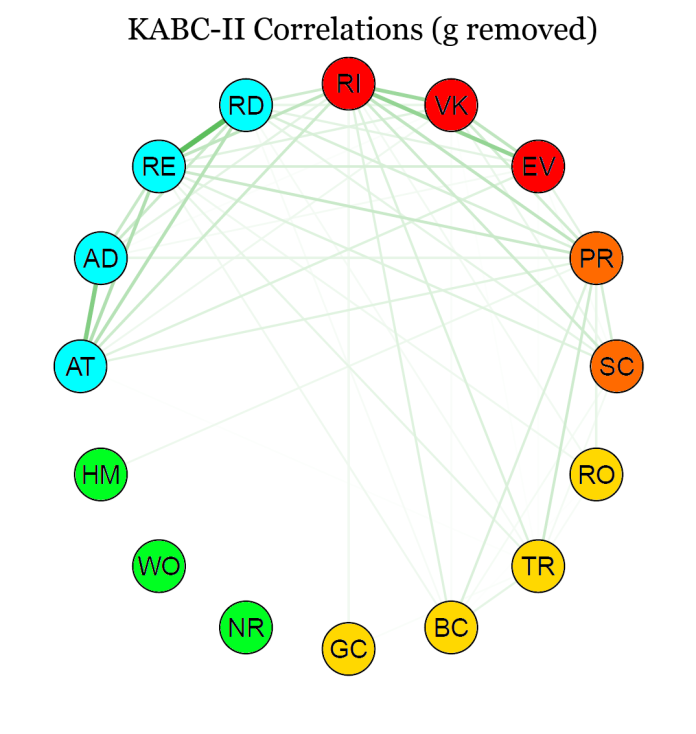
As a follow up to yesterday’s post, I extracted a g factor from the matrix of each battery and made these pictures of the residual matrices. I filtered out all the negative residuals to de-clutter the image.

KABCNog DASNog WISCNog WJNog SB5Nog

I am not sure what can be learned from such pictures other than getting a sense of the magnitudes of the the differences in strength of the different factors. You can see that Gc is generally much stronger than the other factors (except in the case of the SB5).

Standard
CHC Theory, Cognitive Assessment, Psychometrics

Correlation Matrices from Five Cognitive Ability Tests, Visualized

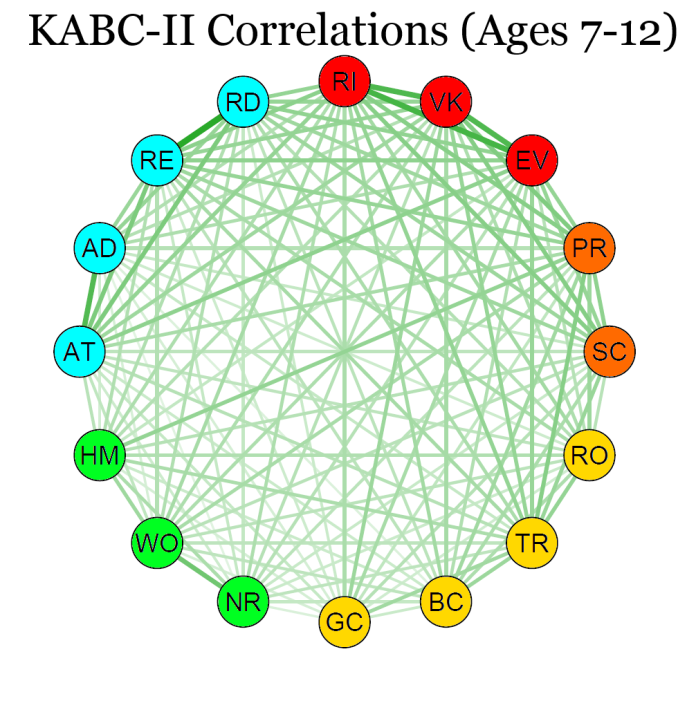
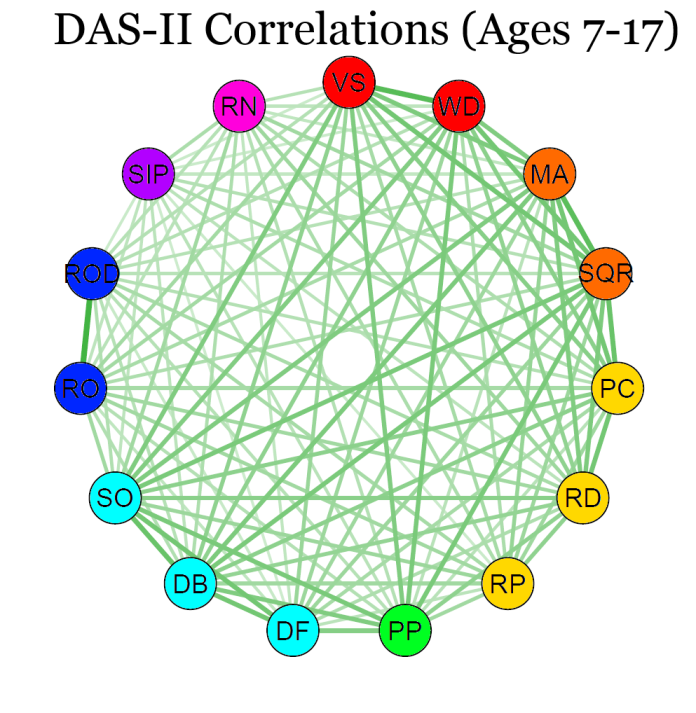
Sometimes it is interesting to look at something familiar in a new way. Here are the correlations among the subtests of five major cognitive ability batteries (data comes from the standardization samples). Stronger correlations are thicker and darker. What do you see?

WJCorrelations KABCCor SB5Correlation WISCCor DASCorrelations

Figures made with semPlot.

Note that color schemes across batteries are not theoretically consistent.

Standard