Cognitive Assessment, R

Is the structure of intelligence different for people with learning disorders? Let’s hope so!

I do not relish criticizing published studies. However, if a paper uses flawed reasoning to arrive at counterproductive recommendations for our field, I believe that it is proper to respectfully point out why the paper’s conclusions should be ignored. This study warrants such a response:

Giofrè, D., & Cornoldi, C. (2015). The structure of intelligence in children with specific learning disabilities is different as compared to typically developing children. Intelligence, 52, 36–43.

The authors of this study ask whether children with learning disorders have the same structure of intelligence as children in the general population. This might seem like an important question, but it is not—if the difference in structure is embedded in the very definition of learning disorders.

An Analogously Flawed Study

Imagine that a highly respected medical journal published a study titled Tall People Are Significantly Greater in Height than People in the General Population. Puzzled and intrigued, you decide to investigate. You find that the authors solicited medical records from physicians who labelled their patients as tall. The primary finding is that such patients have, on average, greater height than people in the general population. The authors speculate that the instruments used to measure height may be less accurate for tall people and suggest alternative measures of height for them.

This imaginary study is clearly ridiculous. No researcher would publish such a “finding” because it is not a finding. People who are tall have greater height than average by definition. There is no reason to suppose that the instruments used were inaccurate.

Things That Are True By Definition Are Not Empirical Findings.

It is not so easy to recognize that Giofrè and Cornoldi applied the same flawed logic to children with learning disorders and the structure of intelligence. Their primary finding is that in a sample of Italian children with clinical diagnoses of specific learning disorder, the four index scores of the WISC-IV have lower g-loadings than they do in the general population in Italy. The authors believe that this result implies that alternative measures of intelligence might be more appropriate than the WISC-IV for children with specific learning disorders.

What is the problem with this logic? The problem is that the WISC-IV was one of the tools used to diagnose the children in the first place. Having unusual patterns somewhere in one’s cognitive profile is part of the traditional definition of learning disorders. If the structure of intelligence were the same in this group, we would wonder if the children had been properly diagnosed. This is not a “finding” but an inevitable consequence of the traditional definition of learning disorders. Had the same study been conducted with any other cognitive ability battery, the same results would have been found.

People with Learning Disorders Have Unusual Cognitive Profiles.

A diagnosis of a learning disorder is often given when a child of broadly average intelligence has low academic achievement due to specific cognitive processing deficits. To have specific cognitive processing deficits, there must be a one or more specific cognitive abilities that are low compared to the population and also to the child’s other abilities. For example, in the profile below, the WISC-IV Processing Speed Index of 68 is much lower than the other three WISC-IV index scores, which are broadly average. Furthermore, the low processing speed score is a possible explanation of the low Reading Fluency score.

WISC IV LD Profile

The profile above is unusual. The Processing Speed (PS) score is unexpectedly low compared to the other three index scores. This is just one of many unusual score patterns that clinicians look for when they diagnose specific learning disorders. When we gather together all the unusual WISC-IV profiles in which at least one score is low but others are average or better, it comes as no surprise that the structure of the scores in the sample is unusual. Because the scores are unusually scattered, they are less correlated, which implies lower g-loadings.

A Demonstration That Selecting Unusual Cases Can Alter Structural Coefficients

Suppose that the WISC-IV index scores have the correlations below (taken from the U.S. standardization sample, age 14).

VC PR WM PS
VC 1.00 0.59 0.59 0.37
PR 0.59 1.00 0.48 0.45
WM 0.59 0.48 1.00 0.39
PS 0.37 0.45 0.39 1.00

Now suppose that we select an “LD” sample from the general population all scores in which

  • At least one score is less than 90.
  • The remaining scores are greater than 90.
  • The average of the three highest scores is at least 15 points higher than the lowest score.

Obviously, LD diagnosis is more complex than this. The point is that we are selecting from the general population a group of people with unusual profiles and observing that the correlation matrix is different in the selected group. Using the R code at the end of the post, we see that the correlation matrix is:

VC PR WM PS
VC 1.00 0.15 0.18 −0.30
PR 0.15 1.00 0.10 −0.07
WM 0.18 0.10 1.00 −0.20
PS −0.30 −0.07 −0.20 1.00

A single-factor confirmatory factor analysis of the two correlation matrices reveals dramatically lower g-loadings in the “LD” sample.

Whole Sample “LD” Sample
VC 0.80 0.60
PR 0.73 0.16
WM 0.71 0.32
PS 0.53 −0.51

Because the PS factor has the lowest g-loading in the whole sample, it is most frequently the score that is out of sync with the others and thus is negatively correlated with the other tests in the “LD” sample.

In the paper referenced above, the reduction in g-loadings was not nearly as severe as in this demonstration, most likely because clinicians frequently observe specific processing deficits in tests outside the WISC. Thus many people with learning disorders have perfectly normal-looking WISC profiles; their deficits lie elsewhere. A mixture of ordinary and unusual WISC profiles can easily produce the moderately lowered g-loadings observed in the paper.

Conclusion

In general, one cannot select a sample based on a particular measure and then report as an empirical finding that the sample differs from the population on that same measure. I understand that in this case it was not immediately obvious that the selection procedure would inevitably alter the correlations among the WISC-IV factors. It is clear that the authors of the paper submitted their research in good faith. However, I wish that the reviewers had noticed the problem and informed the authors that the paper was fundamentally flawed. Therefore, this study offers no valid evidence that casts doubt on the appropriateness of the WISC-IV for children with learning disorders. The same results would have occurred with any cognitive battery, including those recommended by the authors as alternatives to the WISC-IV.

R code used for the demonstration

# Correlation matrix from U.S. Standardization sample, age 14
WISC <- matrix(c(
  1,0.59,0.59,0.37, #VC
  0.59,1,0.48,0.45, #PR
  0.59,0.48,1,0.39, #WM
  0.37,0.45,0.39,1), #PS
  nrow= 4, byrow=TRUE)
colnames(WISC) <- rownames(WISC) <- c("VC", "PR", "WM", "PS")

#Set randomization seed to obtain consistent results
set.seed(1)

# Generate data
x <- as.data.frame(mvtnorm::rmvnorm(100000,sigma=WISC)*15+100)
colnames(x) <- colnames(WISC)

# Lowest score in profile
minSS <- apply(x,1,min)

# Mean of remaining scores
meanSS <- (apply(x,1,sum) - minSS) / 3

# LD sample
xLD <- x[(meanSS > 90) & (minSS < 90) & (meanSS - minSS > 15),]

# Correlation matrix of LD sample
rhoLD <- cor(xLD)

# Load package for CFA analyses
 library(lavaan)
# Model for CFA
m <- "g=~VC + PR + WM + PS"

# CFA for whole sample
summary(sem(m,x),standardized=TRUE)

# CFA for LD sample
summary(sem(m,xLD),standardized=TRUE)
Standard
Cognitive Assessment, Research Link

No, the WISC-IV doesn’t underestimate the intelligence of children with autism.

The title of a new study asks “Does WISC-IV underestimate the intelligence of autistic children?” The authors’ answer is that it probably does. I believe that the reasoning behind this conclusion is faulty.

This study gives the unwarranted impression that it is a disservice to children with autism to use the WISC-IV. Let me be clear—I want to be helpful to children with autism. I certainly do not wish to do anything that hurts anyone. A naive reading of this article leads us to believe that there is an easy way to avoid causing harm (i.e., use the Raven’s Progressive Matrices test instead of the WISC-IV). In my opinion, acting on this advice does no favors to children with autism and may even result in harm.

Based on the evidence presented in the study, the average score differences between children with and without autism is smaller on Raven’s Progressive Matrices (RPM) and larger on the WISC-IV. The rhetoric of the introduction leaves the reader with the impression that the RPM is a better test of intelligence than the WISC-IV. Once we accept this, it is easy to discount the results of the WISC-IV and focus primarily on the RPM.

There is a seductive undercurrent to the argument: If you advocate for children with autism, don’t you want to show that they are more intelligent rather than less intelligent? Yes, of course! Doesn’t it seem harmful to give a test that will show that children with autism are less intelligent? It certainly seems so!

Such rhetoric reveals a fundamental misunderstanding of what individual intelligence tests like the WISC-IV are designed to do. In the vast majority of settings, they are not for certifying how intelligent a person is (whatever that means!). Their primary purpose is to help psychologists understand what a person can and cannot do. They are designed to help explain what is easy and what is difficult for a person so that appropriate interventions can be selected.

The WISC-IV provides a Full Scale IQ, which gives an overall summary of cognitive functions. However, it also gives more detailed information about various aspects of ability. Here is a graph I constructed from Figure 1 in the paper. In my graph, I converted percentiles to index scores and rearranged the order of the scores to facilitate interpretation.

asdf

Average Raven’s Progressive Matrices (RPM) and WISC-IV scores for children with and without autism

It is clear that the difference between the two groups of children is small for the RPM. It is also clear that the difference is also small for the WISC-IV Perceptual Reasoning Index (PRI). Why is this? The RPM and the PRI are both nonverbal measures of logical reasoning (AKA fluid intelligence). Both the WISC-IV and the RPM tell us that, on average, children with autism perform relatively well in this domain. The RPM is a great test, but it has no more to tell us. In contrast, the WISC-IV not only tells us what children with autism, on average, do relatively well, but also what they typically have difficulty with.

It is no surprise that the largest difference is in the Verbal Comprehension Index (VCI), a measure of verbal knowledge and language comprehension. Communication problems are a major component of the definition of autism. If children with autism had performed equally well on the VCI, we would wonder whether the VCI was really measuring what it was supposed to measure. Note that I am not saying that a low score on VCI is a requirement for the diagnosis of autism or that the VCI is the best measure of the kinds of language problems that are characteristic of autism. Rather, I am saying that children with autism, on average, have difficulties with language comprehension and that this difference is manifest to some degree in the WISC-IV scores.

The WISC-IV scores also suggest that, on average, children with autism not only have lower scores in verbal knowledge and comprehension, they are more likely to have other cognitive deficits, including in verbal working memory (as measured by the WMI) and information processing speed (as measured by the PSI).

Thus, as a clinical instrument, the WISC-IV performs its purpose reasonably well. Compared to the RPM, it gives a more complete picture of the kinds of cognitive strengths and weaknesses that are common in children with autism.

If the researchers wish to demonstrate that the WISC-IV truly underestimates the intelligence of children with autism, they would need to show that it underpredicts important life outcomes among this population. For example, suppose we compare children with and without autism who score similarly low on the WISC-IV. If the WISC-IV underestimated the intelligence of children with autism, they would be expected to do better in school than the low-scoring children without autism. Obviously, a sophisticated analysis of this matter would involve a more complex research design, but in principle this is the kind of result that would be needed to show that the WISC-IV is a poor measure of cognitive abilities for children with autism.

Standard
CHC Theory, Cognitive Assessment, Psychometrics

g Factor Removed from Correlation Matrices, Vizualized

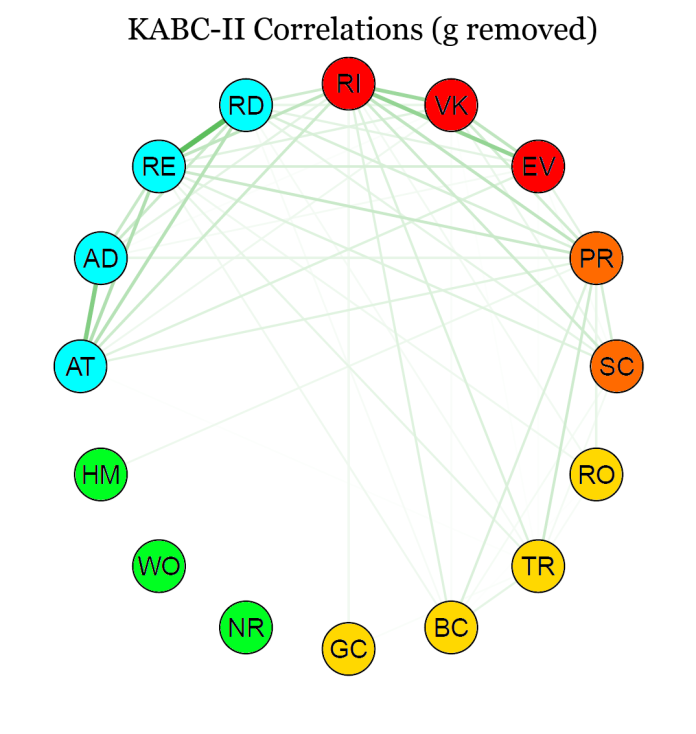
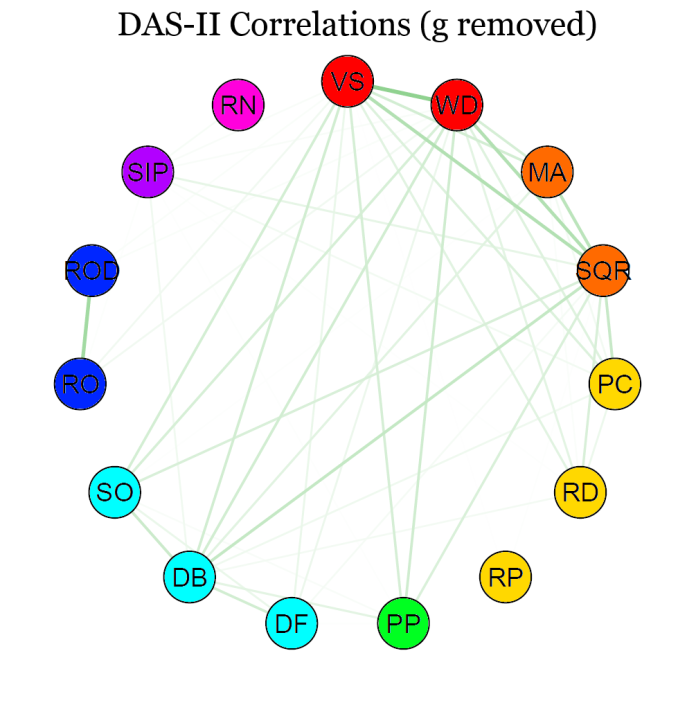
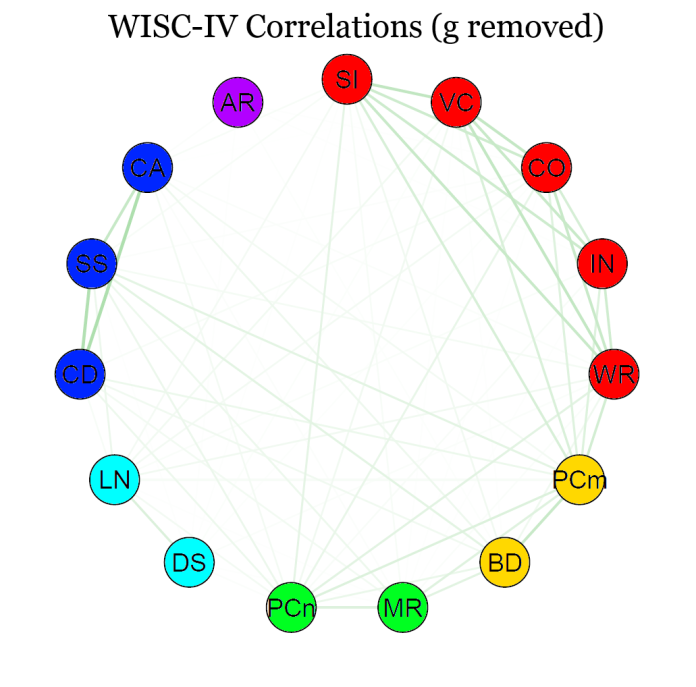
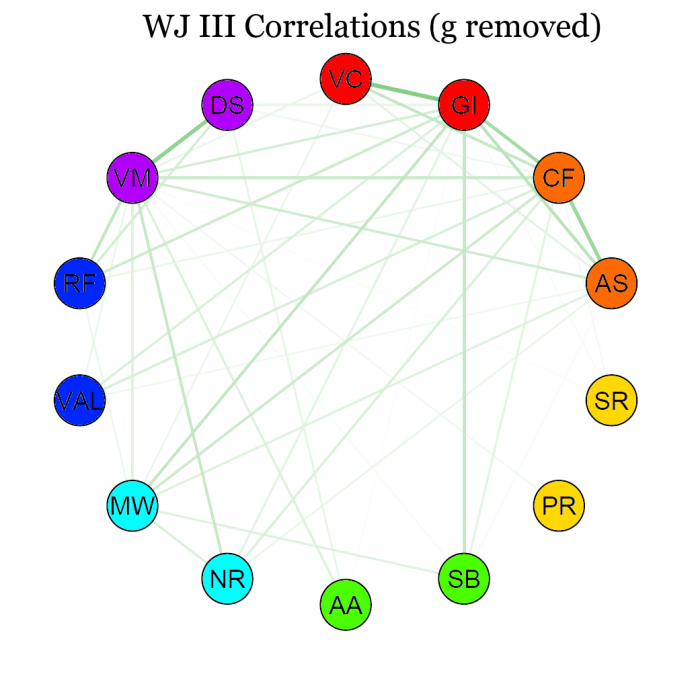
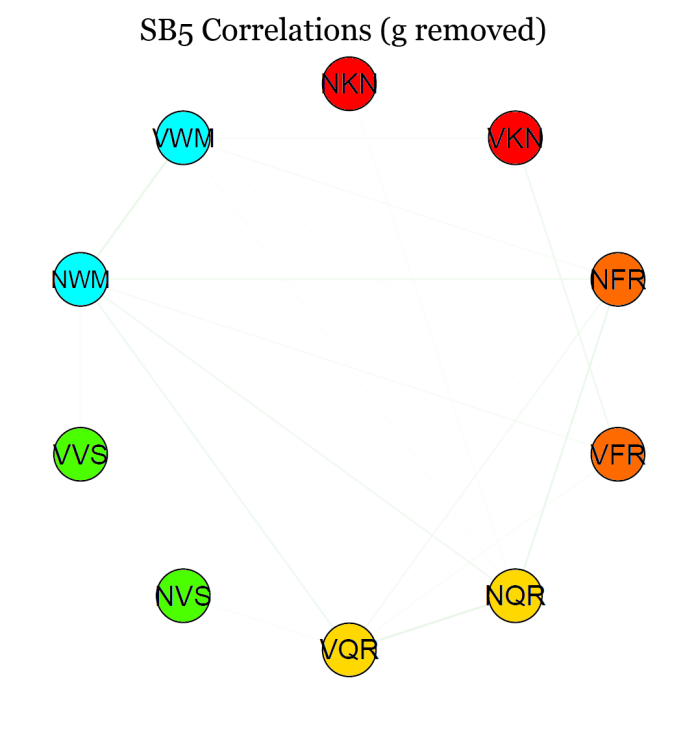
As a follow up to yesterday’s post, I extracted a g factor from the matrix of each battery and made these pictures of the residual matrices. I filtered out all the negative residuals to de-clutter the image.

KABCNog DASNog WISCNog WJNog SB5Nog

I am not sure what can be learned from such pictures other than getting a sense of the magnitudes of the the differences in strength of the different factors. You can see that Gc is generally much stronger than the other factors (except in the case of the SB5).

Standard
CHC Theory, Cognitive Assessment, Psychometrics

Correlation Matrices from Five Cognitive Ability Tests, Visualized

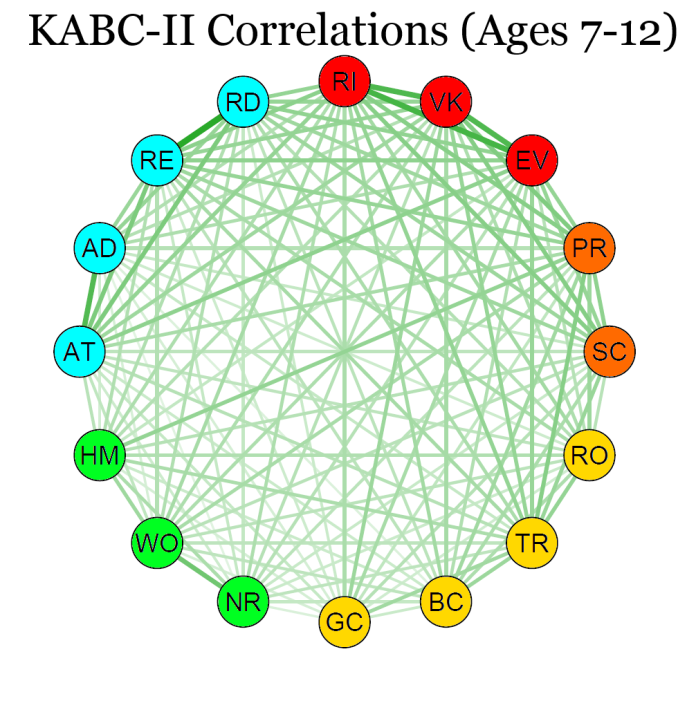
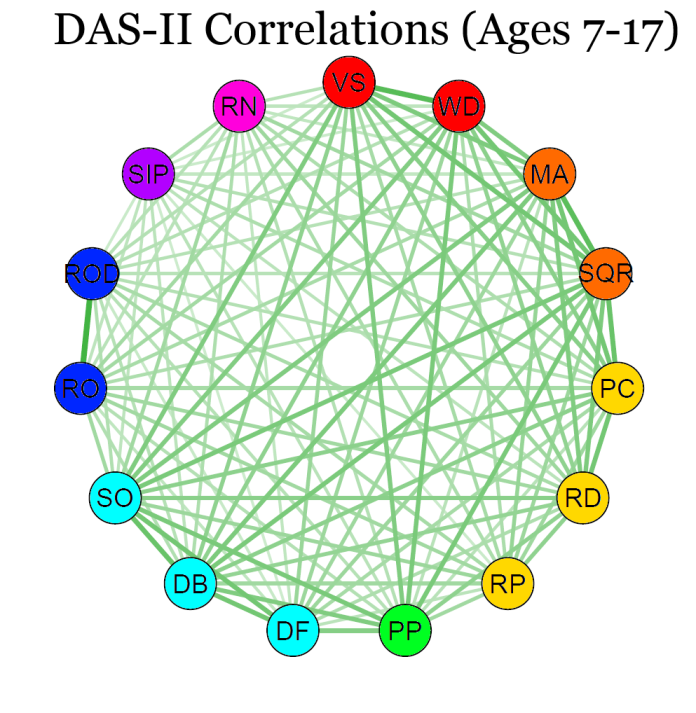
Sometimes it is interesting to look at something familiar in a new way. Here are the correlations among the subtests of five major cognitive ability batteries (data comes from the standardization samples). Stronger correlations are thicker and darker. What do you see?

WJCorrelations KABCCor SB5Correlation WISCCor DASCorrelations

Figures made with semPlot.

Note that color schemes across batteries are not theoretically consistent.

Standard
CHC Theory, Cognitive Assessment, Tutorial

Factor Analysis of the WISC-IV Integrated with a Schmid-Leiman Transformation

On the IAPCHC listserv, the question of what the WISC-IV Integrated Spatial Span measures came up recently. I obtained permission from Pearson to use Tables 5.1, 10.1, and 10.2 to construct a correlation matrix of the subtests in the WISC-IV Integrated. I removed the process scores that have to do with time bonuses. I also removed subtests that are the sum of two, more basic subtests (e.g., Digit Span is the sum of Digits Forward and Digits Backward). This was necessary because the correlation matrix is not positive definite if the parts and the sum are included. A matrix that is not positive definite is impossible to factor analyze.

I used the correlation matrix to extract 5 principal factors with promax rotation. I played around with other factor extractions but a variety of concerns led me to settle on 5 factors. I used the Cattell-Horn-Carroll names for the factors (Gc, Gv, Gsm, Gq, and Gs). I then applied a Schmid-Leiman transformation to the analysis so that it would be parallel to Carroll’s analyses.

Any loading over 0.10 was highlighted. Click the picture to see a larger version.

Note the absence of Gf. I think that Picture Concepts is not a strong enough Gf measure to team up with Matrix Reasoning for it to emerge. Gf often does not emerge anyway because it is so correlated with g.

I used the reliability estimates (averaged across all ages) to estimate how much of the variance in each subtest is error, specific, and shared by g and the 5 smaller factors.

Standard