A man with a watch knows what time it is. A man with two watches is never sure.
-Segal’s Law
Suppose you have been asked to settle a matter with important implications for an evaluee.[1] A young girl was diagnosed with mental retardation [now called intellectual disability] three years ago. Along with low adaptive functioning, her Full Scale IQ was a 68, two points under the traditional line used to diagnose [intellectual disability]. Upon re-evaluation two months ago, her IQ, derived from a different test, was now 78. Worried that their daughter would no longer qualify for services, the family paid out of pocket to have their daughter evaluated by another psychologist and the IQ came out as 66. Because of your reputation for being fair-minded and knowledgeable, you have been asked to decide which, if any, is the real IQ. Of course, there is no such thing as a “real IQ” but you understand what the referral question is.
You give a different battery of tests and the girl scores a 76. Now what should be done? It would be tempting to assume that, “Other psychologists are sloppy, whereas my results are free of error.” However, you are fair minded. You know that all scores have measurement error and you plot the scores and their 95% confidence intervals as seen in Figure 1.
Figure 1
Recent IQ Scores and their 95% Confidence Intervals from the Same Individual

It is clear that Test C’s confidence interval does not overlap with those of Tests B and D. Is this kind of variability in scores unusual?[2] There are two tests that indicate an IQ in the high 60’s and two tests that indicate an IQ in the high 70’s. Which pair of tests is correct? Should the poor girl be subjected to yet another test that might act as a tie breaker?
Perhaps the fairest solution is to treat each IQ test as subtests of a much larger “Mega-IQ Test.” That is, perhaps the best that can be done is to combine the four IQ scores into a single score and then construct a confidence interval around it.
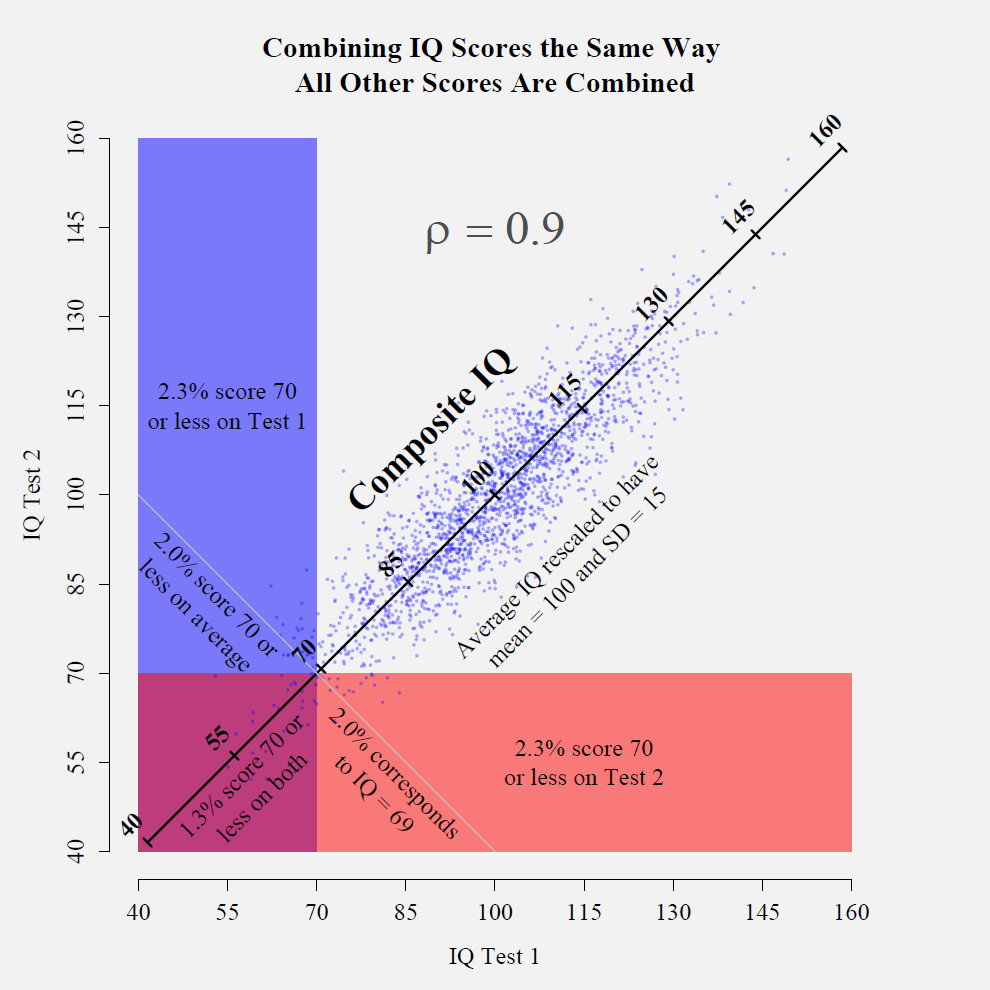
Where should the confidence interval be centered? Intuitively, it might seem reasonable to simply average all four IQ results and say that the IQ is 72. However, this is not quite right. Averaging scores gives a rough approximation of a composite score but it is less accurate for low and high scorers than it is for scorers near the mean. An individual’s composite score is further away from the population mean than the average of the individual’s subtest scores. About 3.1% of people score a 72 or lower on a single IQ test (assuming perfect normality). However, if we were to imagine a population of people who took all four IQ tests in question, only 1.9% of them would have an average score of 72 or lower. That is, it is more unusual to have a mean IQ of 72 than it is to score a 72 IQ on any particular IQ test. It is unusual to score 72 on one IQ test but it is even more unusual to score that low on more than one test on average. Another way to think about this issue is to recognize that the mean score cannot be interpreted as an IQ score because it has a smaller standard deviation than IQ scores have. To make it comparable to IQ, it needs to be rescaled so that it has a “standard” standard deviation of 15.
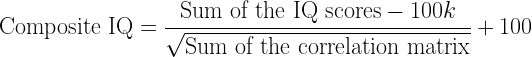
Here is a good method for computing a composite score and its accompanying 95% confidence interval. It is not nearly as complicated as it might seem at first glance. This method assumes that you know the reliability coefficients of all the scores and you know all the correlations between the scores. All scores must be index scores (μ = 100, σ = 15). If they are not, they can be converted using this formula:

Computing a Composite Score
Step 1: Add up all of the scores.
In this case,

Step 2: Subtract the number of tests times 100.
In this case there are 4 tests. Thus,

Step 3: Divide by the square root of the sum of all the elements in the correlation matrix.
In this case, suppose that the four tests are correlated as such:
| |
Test A
|
Test B
|
Test C
|
Test D
|
|
Test A
|
1
|
0.80
|
0.75
|
0.85
|
|
Test B
|
0.80
|
1
|
0.70
|
0.71
|
|
Test C
|
0.75
|
0.70
|
1
|
0.78
|
|
Test D
|
0.85
|
0.71
|
0.78
|
1
|
The sum of all 16 elements, including the ones in the diagonal is 13.18. The square root of 13.18 is about 3.63. Thus,

Step 4: Complete the computation of the composite score by adding 100.
In this case,

Given the four IQ scores available, assuming that there is no reason to favor one above the others, the best estimate is that her IQ is 69. Most of the time, there is no need for further calculation. However, we might like to know how precise this estimate is by constructing a 95% confidence interval around this score.
Confidence Intervals of Composite Scores
Calculating a 95% confidence interval is more complicated than the calculations above but not overly so.
Step 1: Calculate the composite reliability.
Step 1a: Subtract the number of tests from the sum of the correlation matrix.
In this case, there are 4 tests. Therefore,

Step 1b: Add in all the test reliability coefficients.
In this case, suppose that the four reliability coefficients are 0.97, 0.96, 0.98, and 0.97. Therefore,

Step 1c: Divide by the original sum of the correlation matrix.
In this case,
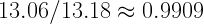
Therefore, in this case, the reliability coefficient of the composite score is higher than that of any single IQ score. This makes sense, given that we have four scores, we should know what her IQ is with greater precision than we would if we only had one score.
Step 2: Calculate the standard error of the estimate by subtracting the reliability coefficient squared from the reliability coefficient and taking the square root. Then, multiply by the standard deviation, 15.
In this case,

Step 3: Calculate the 95% margin of error by multiplying the standard error of the estimate by 1.96.
In this case,

The value 1.96 is the approximate z-score associated with the 95% confidence interval. If you want the z-score associated with a different margin of error, then use the following Excel formula. Shown here is the calculation of the z-score for a 99% confidence interval:

Step 4: Calculate the estimated true score by subtracting 100 from the composite score, multiplying the reliability coefficient, and adding 100. That is,

In this case,

Step 5: Calculate the upper and lower bounds of the 95% confidence interval by starting with the estimated true score and then adding and subtracting the margin of error.
In this case,

This means that we are 95% sure that her IQ is between about 67 and 72. Assuming that other criteria for mental retardation [intellectual disability] are met, this is in the range to qualify for services in most states. It should be noted that this procedure can be used for any kind of composite score, not just for IQ tests.
[2] This degree of profile variability is not at all unusual. In fact, it is quite typical. A statistic called the Mahalanobis Distance (Crawford & Allen, 1994) can be used to estimate how typical an individual profile of scores is compared to a particular population of score profiles. Using the given correlation matrix and assuming multivariate normality, this profile is at the 86th percentile in terms of profile unusualness…and almost of all of the reason that it is unusual is that its overall elevation is unusually low (Mean = 72). If we consider only those profiles that have an average score of 72, this profile’s unusualness is at the 54th percentile (Schneider, in preparation). That is, the amount of variability in this profile is typical compared to other profiles with an average score of 72.
This post is an excerpt from:
Schneider, W. J. (2013). Principles of assessment of aptitude and achievement. In D. Saklofske, C. Reynolds, & V. Schwean (Eds.), Oxford handbook of psychological assessment of children and adolescents (pp. 286–330). New York: Oxford.
Figure 1 was updated from the original to show more accurately the precision that IQ scores have.