CHC Theory, Cognitive Assessment

Exploratory model of cognitive predictors of academic skills that I presented at APA 2014

I have many reservations about this model of cognitive predictors of academic abilities that I presented at APA today (along with co-presenters Lee Affrunti, Renée Tobin, and Kimberley Collins) but I think that it illustrates an important point: prediction and explanation of cognitive and academic abilities is so complex that it is impossible to do in one’s head. Eyeballing scores and making pronouncements is not likely to be accurate and will result in misinterpretations. We need good software that can manage the complex calculations for us. We can still think creatively in the diagnostic process but the creativity must be grounded in realistic probabilities.

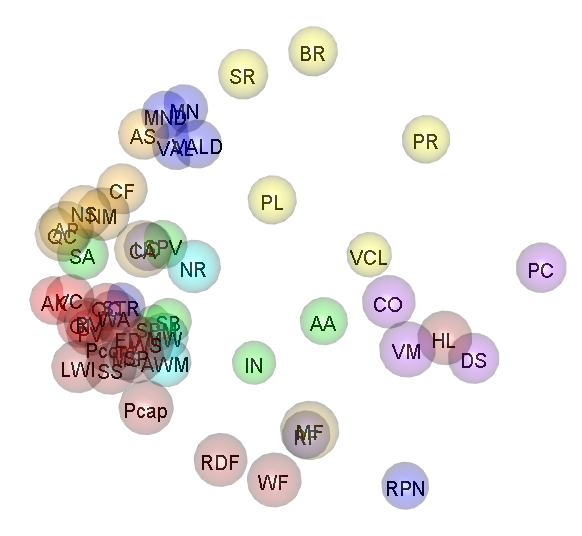
The images from the poster are from a single exploratory model based on a clinical sample of 865 college students. The model was so big and complex I had to split the path diagram into two images:

Exploratory Model of WAIS and WJ III cognitive subtests

Exploratory Model of WAIS and WJ III cognitive subtests. Gc = Comprehension/Knowledge, Ga = Auditory processing, Gv = Visual processing, Gl = Long-term memory: Learning, Gr = Long-term memory: Retrieval speed, Gs = Processing speed, MS = Memory span, Gwm = Working memory capacity, g = Anyone’s guess

Exploratory model of cognitive predictors of WJ III academic subtests

Exploratory model of cognitive predictors of WJ III academic subtests. Percentages in error terms represent unexplained variance.

Standard
CHC Theory, Cognitive Assessment, R

Interactive 3D Multidimensional Scaling of the WJ III

I have been playing around with interactive 3D images (with the rgl package in R) and thought that it would be fun to present a multidimensional scaling (MDS) of the WJ III NU. Kevin McGrew has produced a number of beautiful images with MDS. My favorite is this one, not just because it is gorgeous, but because of the theoretical insights it communicates.

I simply took the correlation matrix from the WJ III NU standardization sample (ages 9 to 13) and subtracted each correlation from 1 to produce a distance measure. I performed classic MDS in R with the cmdscale function, allowing 3 dimensions. I colored each test with my guess as to which CHC factor it belongs.

If you click the static image below, you can play with it (Firefox and Chrome worked for me but Internet Explorer and Safari did not.):

WJ III MDS in 3D

WJ III MDS in 3D

R code used to generate this image

Standard
CHC Theory, Cognitive Assessment, Psychometrics

g Factor Removed from Correlation Matrices, Vizualized

As a follow up to yesterday’s post, I extracted a g factor from the matrix of each battery and made these pictures of the residual matrices. I filtered out all the negative residuals to de-clutter the image.

KABCNog DASNog WISCNog WJNog SB5Nog

I am not sure what can be learned from such pictures other than getting a sense of the magnitudes of the the differences in strength of the different factors. You can see that Gc is generally much stronger than the other factors (except in the case of the SB5).

Standard
CHC Theory, Cognitive Assessment, Psychometrics

Correlation Matrices from Five Cognitive Ability Tests, Visualized

Sometimes it is interesting to look at something familiar in a new way. Here are the correlations among the subtests of five major cognitive ability batteries (data comes from the standardization samples). Stronger correlations are thicker and darker. What do you see?

WJCorrelations KABCCor SB5Correlation WISCCor DASCorrelations

Figures made with semPlot.

Note that color schemes across batteries are not theoretically consistent.

Standard